In this article
What you will learn
- Why the squad average is not the right yardstick for judging one athlete.
- How to build an athlete's "usual" and how to read a day against it.
- What the team average is really for.
The problem
Anyone who has worked in a staff room knows the scene. The session table on the screen, the squad average at the bottom, reds and greens. Someone points at the centre-back: "He's below." And the centre-back had done exactly what they always do on that day of the week. In the same table, a midfielder "on the average" was at least seven hundred metres below their usual, and nobody was looking.
The table with the team average at the bottom is the first report almost all of us built. It is convenient: one number, everyone above or below it, one colour. The trouble is the question it answers. It tells you where an athlete stands compared with their teammates. It does not tell you whether that athlete is different from themselves today, and that is the question we ask the morning after a session.
A centre-back and a central midfielder do not cover the same distance, even in the most ordinary week of the season. Putting them under the same line means measuring position, build and playing style. All real things, but none of them changes from one Tuesday to the next.
An example with numbers
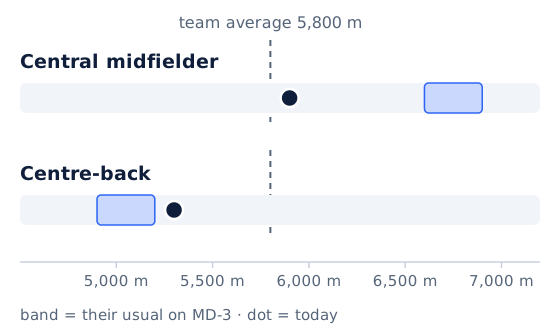
Two athletes from the same squad, total distance on an (illustrative data).
| Their usual on MD-3 | Today | Team average today | Against the team | Against themselves | |
|---|---|---|---|---|---|
| Central midfielder | 6,600 – 6,900 m | 5,900 m | 5,800 m | "above average" | more than 10% below their usual |
| Centre-back | 4,900 – 5,200 m | 5,300 m | 5,800 m | "below average" | just above their usual |
With the team average as the yardstick, the midfielder looks fine and the centre-back looks like the one worth a look. Against themselves, it is the other way round: the midfielder did a lot less than usual, while the centre-back did his normal day's work.
The calculations, row by row, against the two yardsticks:
| Against the team average (5,800 m) | Against the nearest edge of their usual | |
|---|---|---|
| Central midfielder | (5,900 − 5,800) ÷ 5,800 = +1.7% | (5,900 − 6,600) ÷ 6,600 = −10.6% |
| Centre-back | (5,300 − 5,800) ÷ 5,800 = −8.6% | (5,300 − 5,200) ÷ 5,200 = +1.9% |
Against the team, the sign tells you who is bigger or smaller than the others; against themselves, it tells you who has changed. They are two different questions, and here the two signs are reversed.
This is not a case built to make a point. It happens whenever a squad mixes positions and body types, which is to say always.
What the science says
The NSCA's sport science textbook (NSCA's Essentials of Sport Science, the reference text for the CPSS exam) deals with the issue in two chapters.
In chapter 21, on how data are presented, the authors compare two ways of reading the same wellness questionnaire: the raw values ranked, one player against another, and the same values . They ask the right question: both views answer something, but which one helps you make a decision? The second, because it puts every athlete on their own scale: zero is their usual, −1.5 is a value that is rare for them. They add a caveat worth remembering: the transformation holds if the values are roughly bell-shaped; if they are heavily skewed to one side, it is not the right method.
Chapter 6, on profiling and benchmarking, does not throw away comparison with others: ranking the athletes in a squad on a test shows strengths and weaknesses, and reference values tell you where someone sits. But it recommends that, where possible, the comparison is also made on the individual, and it points out that an athlete's variability from one test to the next is one of the things you need to know before you interpret a result.
Outside sport the issue has a name: estimates made on a group do not necessarily describe how one person varies over time. Molenaar framed it as a methodological problem back in 2004; Fisher and colleagues showed it in data in 2018, comparing variability between people with variability within the same person: the two did not match. In sport, Thornton and colleagues (2019) review the methods for analysing a team's monitoring data, including how to decide whether a change is meaningful and how to present it to the coach simply.
Finally, to say whether a change is real you need to know how much the test fluctuates for that athlete: that is the described by Hopkins (2000), and the framework from Swinton and colleagues (2018) shows how to use it to read the individual response.
The most common mistakes
- Colouring the individual against the group average. The colour ends up measuring position and build, which do not change from one day to the next.
- Building the usual from every day thrown together. An MD-3 is compared with MD-3s, the match with matches.
- Forgetting the noise. A difference smaller than the test's does not tell you that something has changed.
- Passing off a comparison with others as a judgement when the athlete has just arrived and has no usual yet: better to say "norm still too short".
What the team average is really for
It should not be thrown away. It should be used for the right questions:
- describing the squad: how much the group worked this week, how the session went;
- planning: the load of a session for the group, the shape of the microcycle;
- profiling: where an athlete sits on a test compared with teammates or an external reference, for example in an academy (with the usual caution about maturation).
What it must not do is judge an individual change.
The biggest change isn't on the sheet; it's in the question the staff ask in the morning. No longer "who is below the average?", but "who is different from themselves today?"
Cite
MarkerDrift team (2026). The team average is not a norm. MarkerDrift Journal. https://www.markerdrift.com/en/journal/the-team-average-is-not-a-normRelated articles
48%: the anatomy of an alert rule that cried wolf
On a simulated season a common rule lit up one day in two. The first fix brought it down to 8%, but for the wrong reason
MarkerDrift team · 3 November 2026 · 13 min read